


With my years of experience as a Scrum Master, I have never missed making agile reports for a project. The reason is straightforward: agile reports help manage funds, better allocate resources, and approve and track plans at the department or programme level.
However, I have also faced repercussions of making reports quickly and submitting them with some errors that do not add any value to the process. Therefore, creating reports that add value to your project and help you in the process is also important.
Points to note while preparing reports
Making reports merely of the reason that everyone is doing that can be the most damaging thing you can do for your project at the same time killing your time unnecessarily. There are two primary things you should keep in mind while making reports: “Why and What”
Why you’re making reports?
- Here are the key purposes of making reports for your project or organization:
- If you’re initiating a project, you can showcase how well your project is doing
- If you’re facing any challenges in the project, you can highlight them to the management with the help of reports.
- If you want to see how your teammates are making progress, reports are one way to do that.
When you understand the value of reports to project management, your project efficiency and productivity will be enhanced automatically.
What are you reporting?
Well, this is one question I ask every scrum master starting with preparing reports. They laugh and get uncomfortable but this question is the essence of reporting and it adds value to your projects. You must know your end goal for creating agile reports.
You can easily drown in the sea of data available and get confused about which data is worth putting in reports. In this situation, you should let the agile metrics anchor your way. You can get more information on Agile metrics here
Types of Agile Reports and Charts
If you’re starting off to figure out which Agile report you should consider to analyse your projects, I am here to help. Let’s figure out what are the primary types of Agile Reports to track your projects.
Burndown and Burnup Charts
A burndown chart measures the amount of work left for the taken timeline whereas a burnup chart measures the amount of work completed for the taken timeline.
With these charts, you can figure out in a single glance, how much work you have completed, how much is left and forecast how much time you require to complete the project.
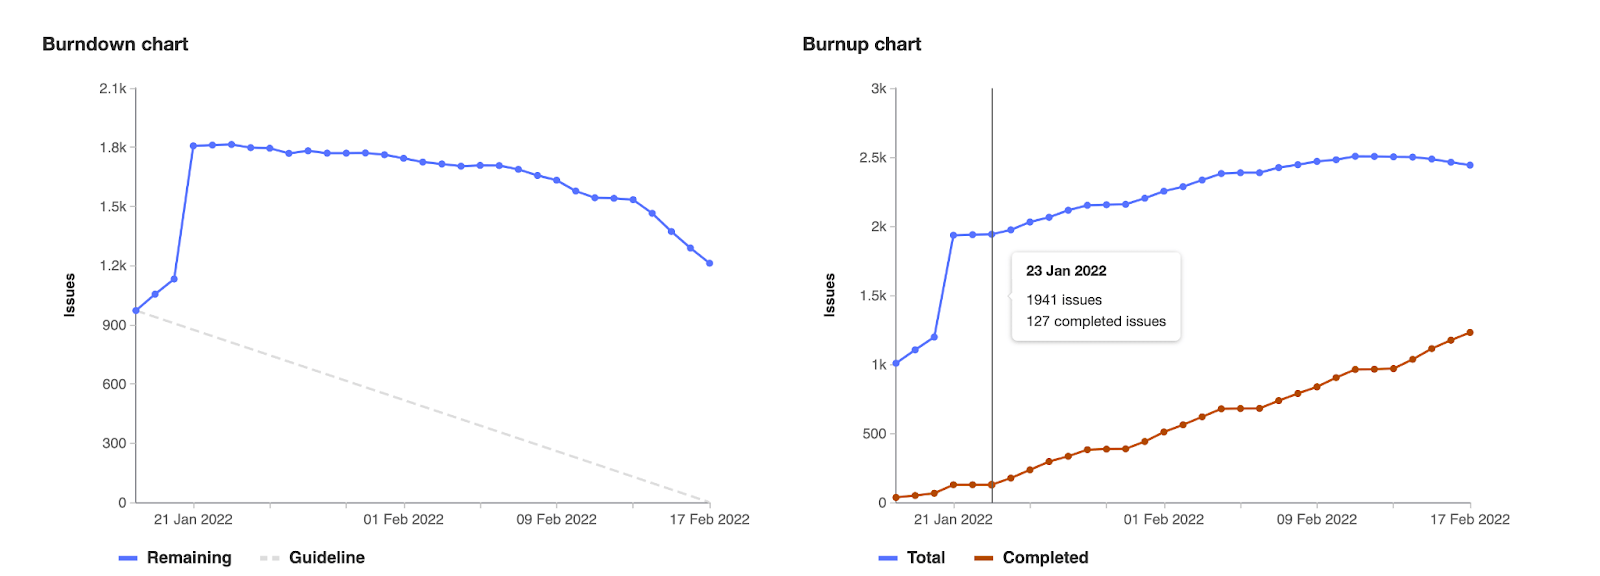
Source: Gitlab
Velocity Graph
You can prepare a velocity graph for every sprint. It covers the comparison of committed estimation points vs completed estimation points. The average of both is called the average velocity of the sprint.
The velocity of the team is a measurement of their capacity and how much work they can take in their next sprints. The value of scrum can be best defined by making decisions based on current inputs and with velocity graphs you can do the same. The velocity graphs will help you move in the direction of taking the perfect amount of work in the particular timeline.
In the first sprints, the team velocity can fluctuate but it becomes stagnant once the team figures out the workload.
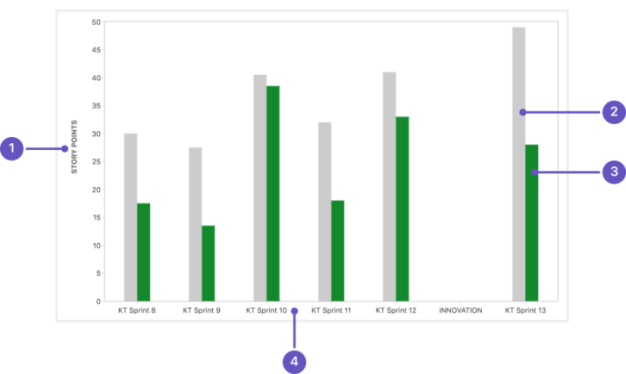
Source: Atlassian
Cumulative Flow Diagram
A cumulative flow diagram helps in tracking down the number of work items in each status(to do, doing, completed) in a particular timeframe.
In a typical cumulative flow diagram, the “to do” goes down throughout the sprint and the work items with “done” increase.
This diagram helps you understand the different statuses in your workflow and recognise which area is the most stagnant. This is one of my favourite methods to track down the efficiency of the team and also see if the team is meeting the expectations of the project or not.
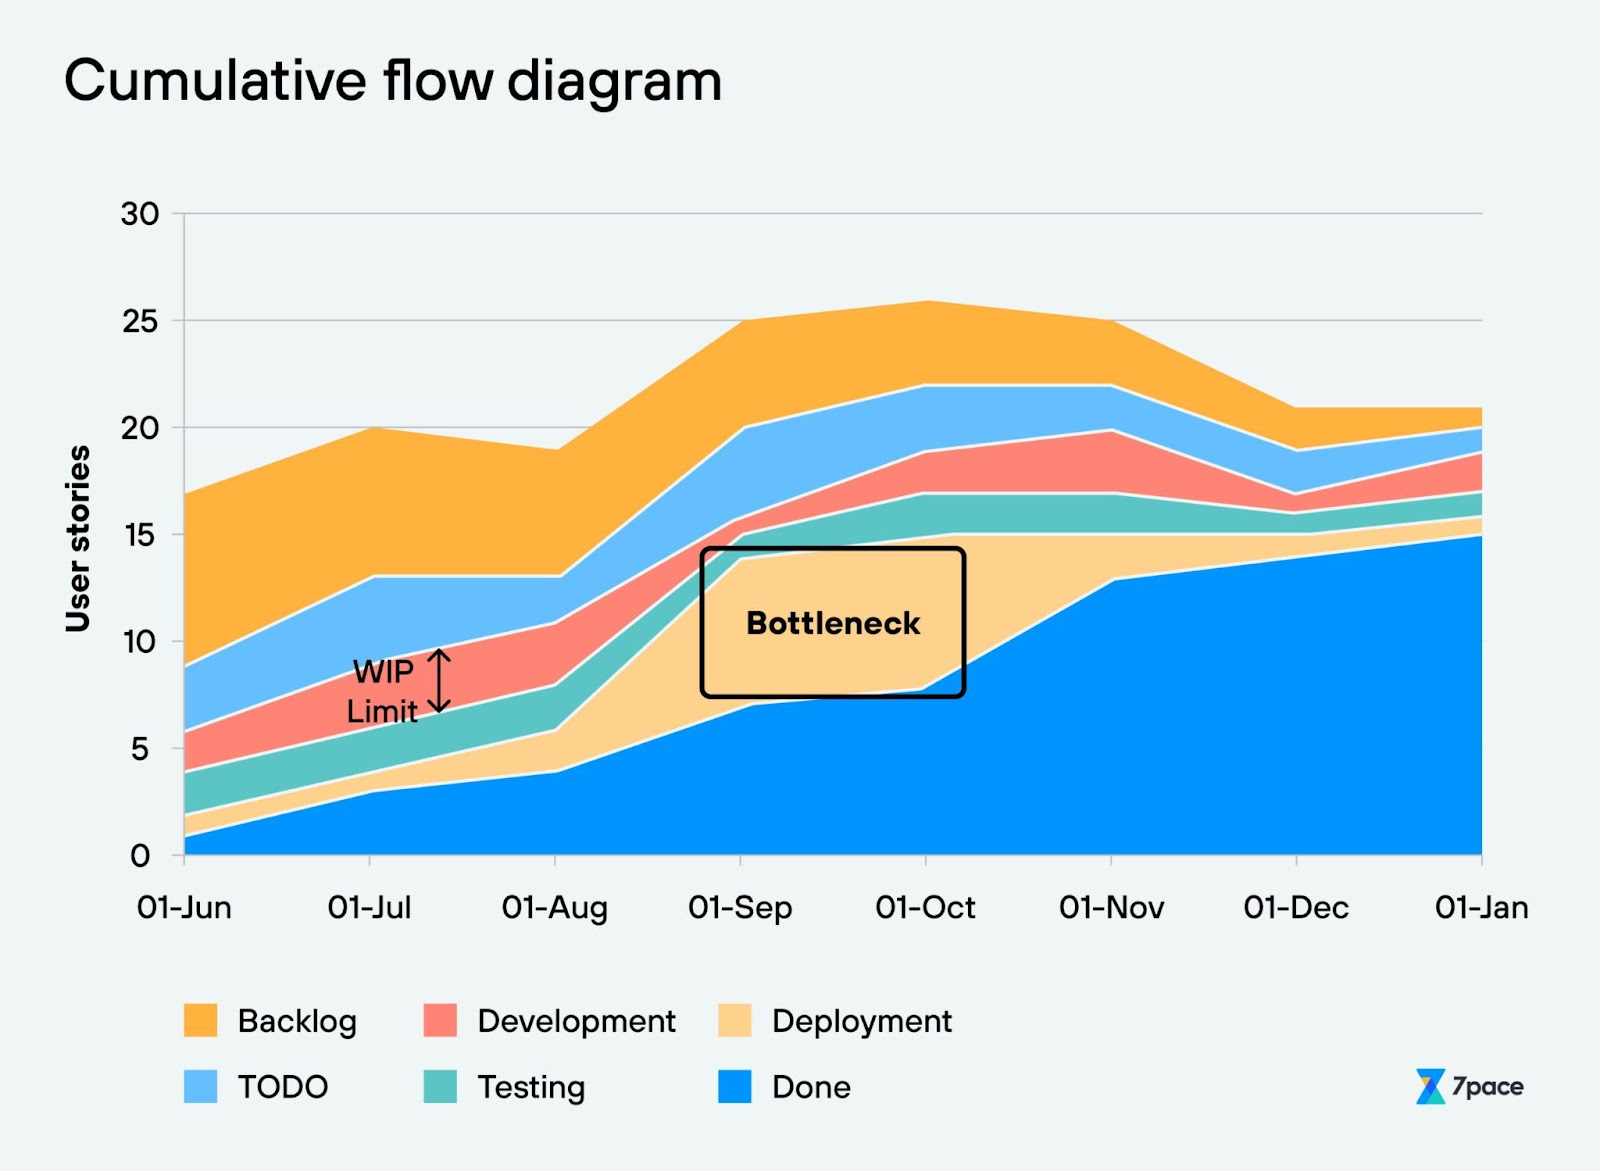
Source: 7Pacetracker
Status Timeline and Item Process Time
If you want to track the details of a single work item, then I will recommend you to go with this agile reporting method. The status timeline tracks the work item through its stages along with information like how much time was spent, and who made transitions. You can also see where the most and least time is spent.
The cumulative process diagram shows you how the work items are processed overall whereas if you need work item-wise updates then the status timeline will be helpful.
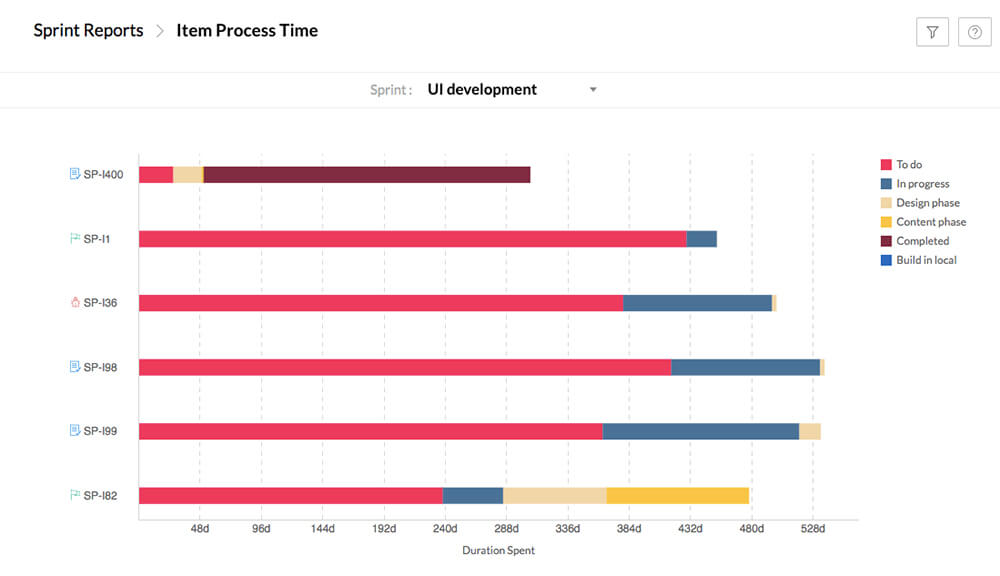
Source: Zoho
Cycle Time Scatterplot
This report will help you analyse all the work assignments that the time have completed in a particular time. This will help you make an informed decision about the project delivery.
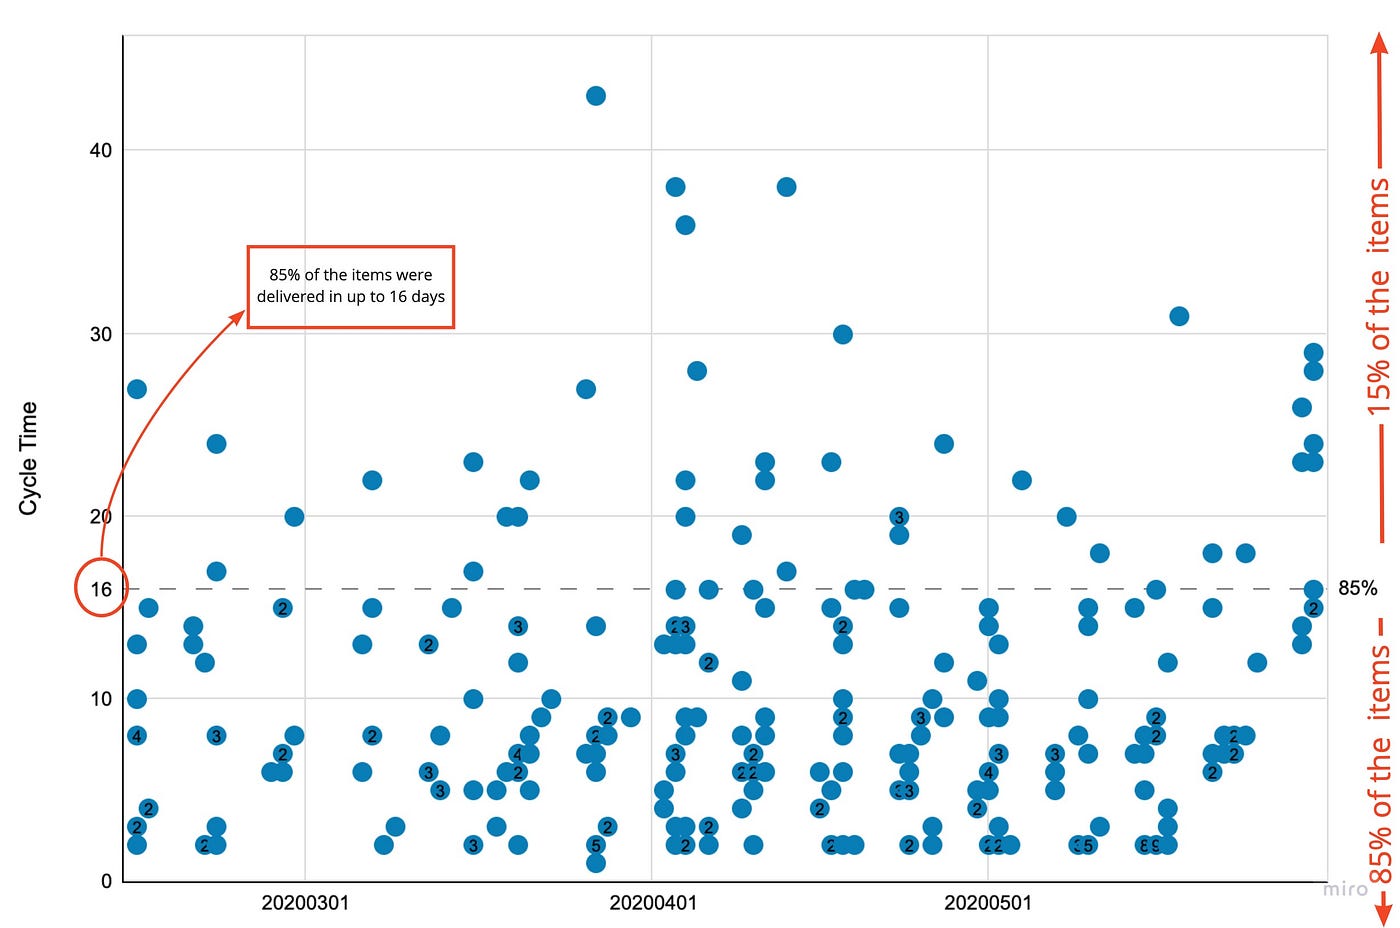
Source: Medium
Benefits of Agile Reporting
Reporting always brings transparency and better credibility as a ScrumMaster to you! Here are the primary benefits I can state based on my years of experience as a scrum master:
1. Improved visibility and transparency: The primary benefit of Agile reporting is improved visibility of the project's progress. It provides a consolidated view of relevant project data, helping stakeholders understand project progress, any impediments and the time taken to complete tasks.
2. Enhanced Decision-making: As the reports provide real-time access to project metrics, they help the stakeholders to make informed and better decisions. With all the data available, the team can make necessary adjustments to ensure project success.
3. Increased efficiency and productivity: Agile reporting gives real-time insights to the teams which helps them optimise and adjust their workflows. They can judge areas of improvement and make necessary changes to achieve project success.

Best Practices for Agile Reporting
To make reporting efficient, it is crucial to define goals and the stakeholders easily understand them. Here are the best practices I still follow to make agile reporting most useful:
1. Define goals for your report: One of the prominent reasons to make reports is to see how your team is performing against the goals set. So, is your goal to see the timely delivery of the project, and to analyse the progress or performance? If you’re starting off by creating Agile reports, it is essential to know what you want to achieve through it and what type of data you want to gather and analyse.
2. Easy-to-understand reports: Make reports which are visually descriptive and easily understood by your stakeholders. For instance: a cumulative flow diagram can help your stakeholders understand your team's progress easily.
3. Make use of the data collected: It is also important to take your lessons from the reports you’re preparing. At the beginning of your sprint, while defining goals, you can make decisions based on the reports produced earlier. This will help to create more accurate and achievable goals for the team.
Tools and Charts for Agile Reporting
1. Story Mapping: Story mapping is a technique to arrange the user stories or backlog items in a hierarchy of top to down so you know the new feature launching.
This technique helps to prioritise the work and make decisions accordingly.
2. Control Charts: This tool is ideal for monitoring the stability and fluctuations in a project. Agile teams can use it to understand how fast they can fix the issues in the backlog. Control charts are helpful for agile teams to understand if anything is going out of hand and needs immediate fixing.
3. Kanban Boards:Kanban boards help in visualising the project's progress and also make it very transparent for everyone to see where the project is headed. Anyone in the company can access the project's progress, update the status and add comments.
4. Jira: Jira is one of the most useful tools for agile project management, which I use for all my projects. It is a multi-facet tool that helps in making scrum, kanban boards. Moreover, you can provide various kinds of reports with the help of this tool.
In the scrum board itself, you can make burnup charts, burndown charts, velocity charts, version reports and many more.
5. Zoho: Managing backlog and releases can be a little tricky if you do not have the right tool with you. Zoho’s dashboard helps you keep track of the overall project success. You can manage your backlog and keep track of your releases on the same platform.
Challenges in Agile Reporting
In my experience of handling projects and implementing scrum in many organizations, these are the primary challenges that arise in Agile Reporting:
Often agile teams do not realise the purpose of agile reporting. They often create reports just for the sake of management requirements. This is wrong on so many levels, as you’re running to achieve project success but your success parameters are not defined.
The Agile team lack information to report clearly how their team contributes to more overall business requirements.
Agile teams are self-sufficient and they can plan and execute the work independently. However organizations on a larger scale often have defined parameters for reporting, this may make the individuals feel pressurised and bound to follow the guidelines of the firm.
The frequency of gathering and analysing the data increases, and this necessitates automating the reports. It will take extra effort from the team members end apart from their usual tasks.
The reports can be misinterpreted and not understood completely at higher levels. The reports are either too extensive and vivid or too brief and compact which leads to confusion for the higher management who is not aware of the daily tasks of the team.
Conclusion
In my extensive experience as a scrum master, I have realised that agile reporting not only helps in optimizing project management but also enhances transparency and improves decision-making.
It is essential to avoid any hasty and error-prone reports but also adhere to best agile practices to make useful reports. If you are a scrum master or planning to start your career as a scrum master, you must know how to create agile reports. To know more about it you can enrol in our scrum master certification course that will not only help you gain better knowledge about agile reporting but also other scrum concepts.
FAQ
1. Why is a progress report important in agile practices?
The progress report can highlight any impediments, bottlenecks and improvement areas. This will help the team make informed decisions and track the progress of the project.
2. How to track project progress in Agile?
You can check how fast the project is progressing with the help of a velocity chart. You can calculate the velocity for each sprint (tasks completed vs tasks estimated) and see how your project is progressing. Velocity is calculated by dividing the number of completed tasks by the number of days in a sprint.


