


Data Analytics Certification Course Online
 100% Placement Assistance
 3-month Data Analytics Classes online for IT/non-IT pros & students.
 - Participants receive a certification from StarAgile upon completion.
- Earn Microsoft certifications that are accredited by top MNCs.
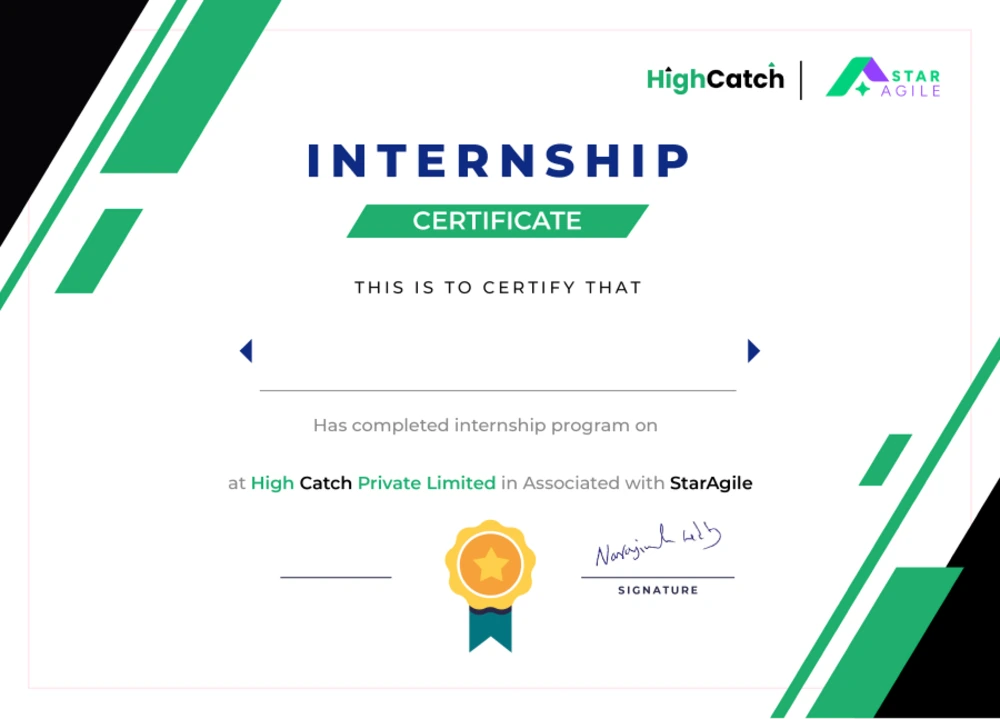
- Receive an industry-recognized 3-month internship certification.
- Our data analytics course is taught by expert trainers from top MNCs.
- Data Analytics course includes career coaching and personalized guidance.
- Career guidance, including mock interviews and resume building.


Data Analytics Course – Key Features
 104 hours of live online training.
 - 3-month internship.
- Master 6+tools.
- Real-world case studies
 104 hours of live online training.
 - Hands-on assignments.
- Personalized career coaching.
- Globally recognized Microsoft Certification.
- Suits IT & non-IT professionals and students.
Significant Demand Growth


Analyst roles globally
Let's walk you through the journey at StarAgile

- Module 1
- Module 2
- Module 3
- Module 4
- Module 5
- Module 6
- Module 7
- Module 8
Learning Outcome:
Apply advanced Excel capabilities to clean, transform, analyze, and summarize data, and build interactive analytical reports and dashboards for business decision support.


- Profile and Resume building
- Business Communication
- Competency Challenge Test
- Technical Mock Interviews
- Profile and Resume building
- Portfolio Building
- Build highly optimized Resumes and Cover Letters
- Build your LinkedIn Profile


Data Analytics Training Online Batches

Currently, we don't have any batch scheduled in your region.
You can request a new batch on your preferred date!
The work force is your asset. Up-Skill them with our Corporate Training Programs!
- Unleash In-Demand Skills Across the Enterprise
- Align Skill Development with Business Objectives
- Drive Increased Employee Productivity
- Leverage Immersive Learning
What is Data Analytics Course: Overview
A data analytics program helps you build capabilities to examine data, uncover meaningful patterns, and guide business decisions. The curriculum typically includes essential topics such as SQL, Excel, Python, statistical methods, and creating visual representations of data.
Course formats and features
- Interactive Online Sessions: StarAgile's data analytics training offers live, instructor-led classes with scheduling options that fit your routine.
- Practical Learning Approach: The program emphasizes real application through hands-on exercises, industry case studies, and actual project work.
- Comprehensive Support: Participants receive guidance from experienced instructors, dedicated mentors, and teaching assistants throughout their learning journey.
- Career Development Services: The course includes professional support such as resume enhancement and practice interview sessions to prepare you for the job market.
- Training for All Levels: Whether you're starting fresh or looking to develop specialized expertise, the program accommodates learners at different stages with Beginner-friendly training and Specialized skill-based training paths.
This data analytics certification course delivers hands-on training in industry-standard tools, giving you practical skills valued across sectors.
It includes real-world case studies taught by experienced professionals to help you understand the practical applications of data analytics.
Upon completion, you will receive the data analytics classes online along with a 3-month internship certificate, boosting your job readiness.
The flexible programs allow you to learn at your own pace while interacting with experts and mentors.
Gain proficiency in SQL, Python, R, and Tableau—essential skills for solving complex data challenges in a data-driven environment.
Data Analytics Course Completion Certificate
- Internship Certificate
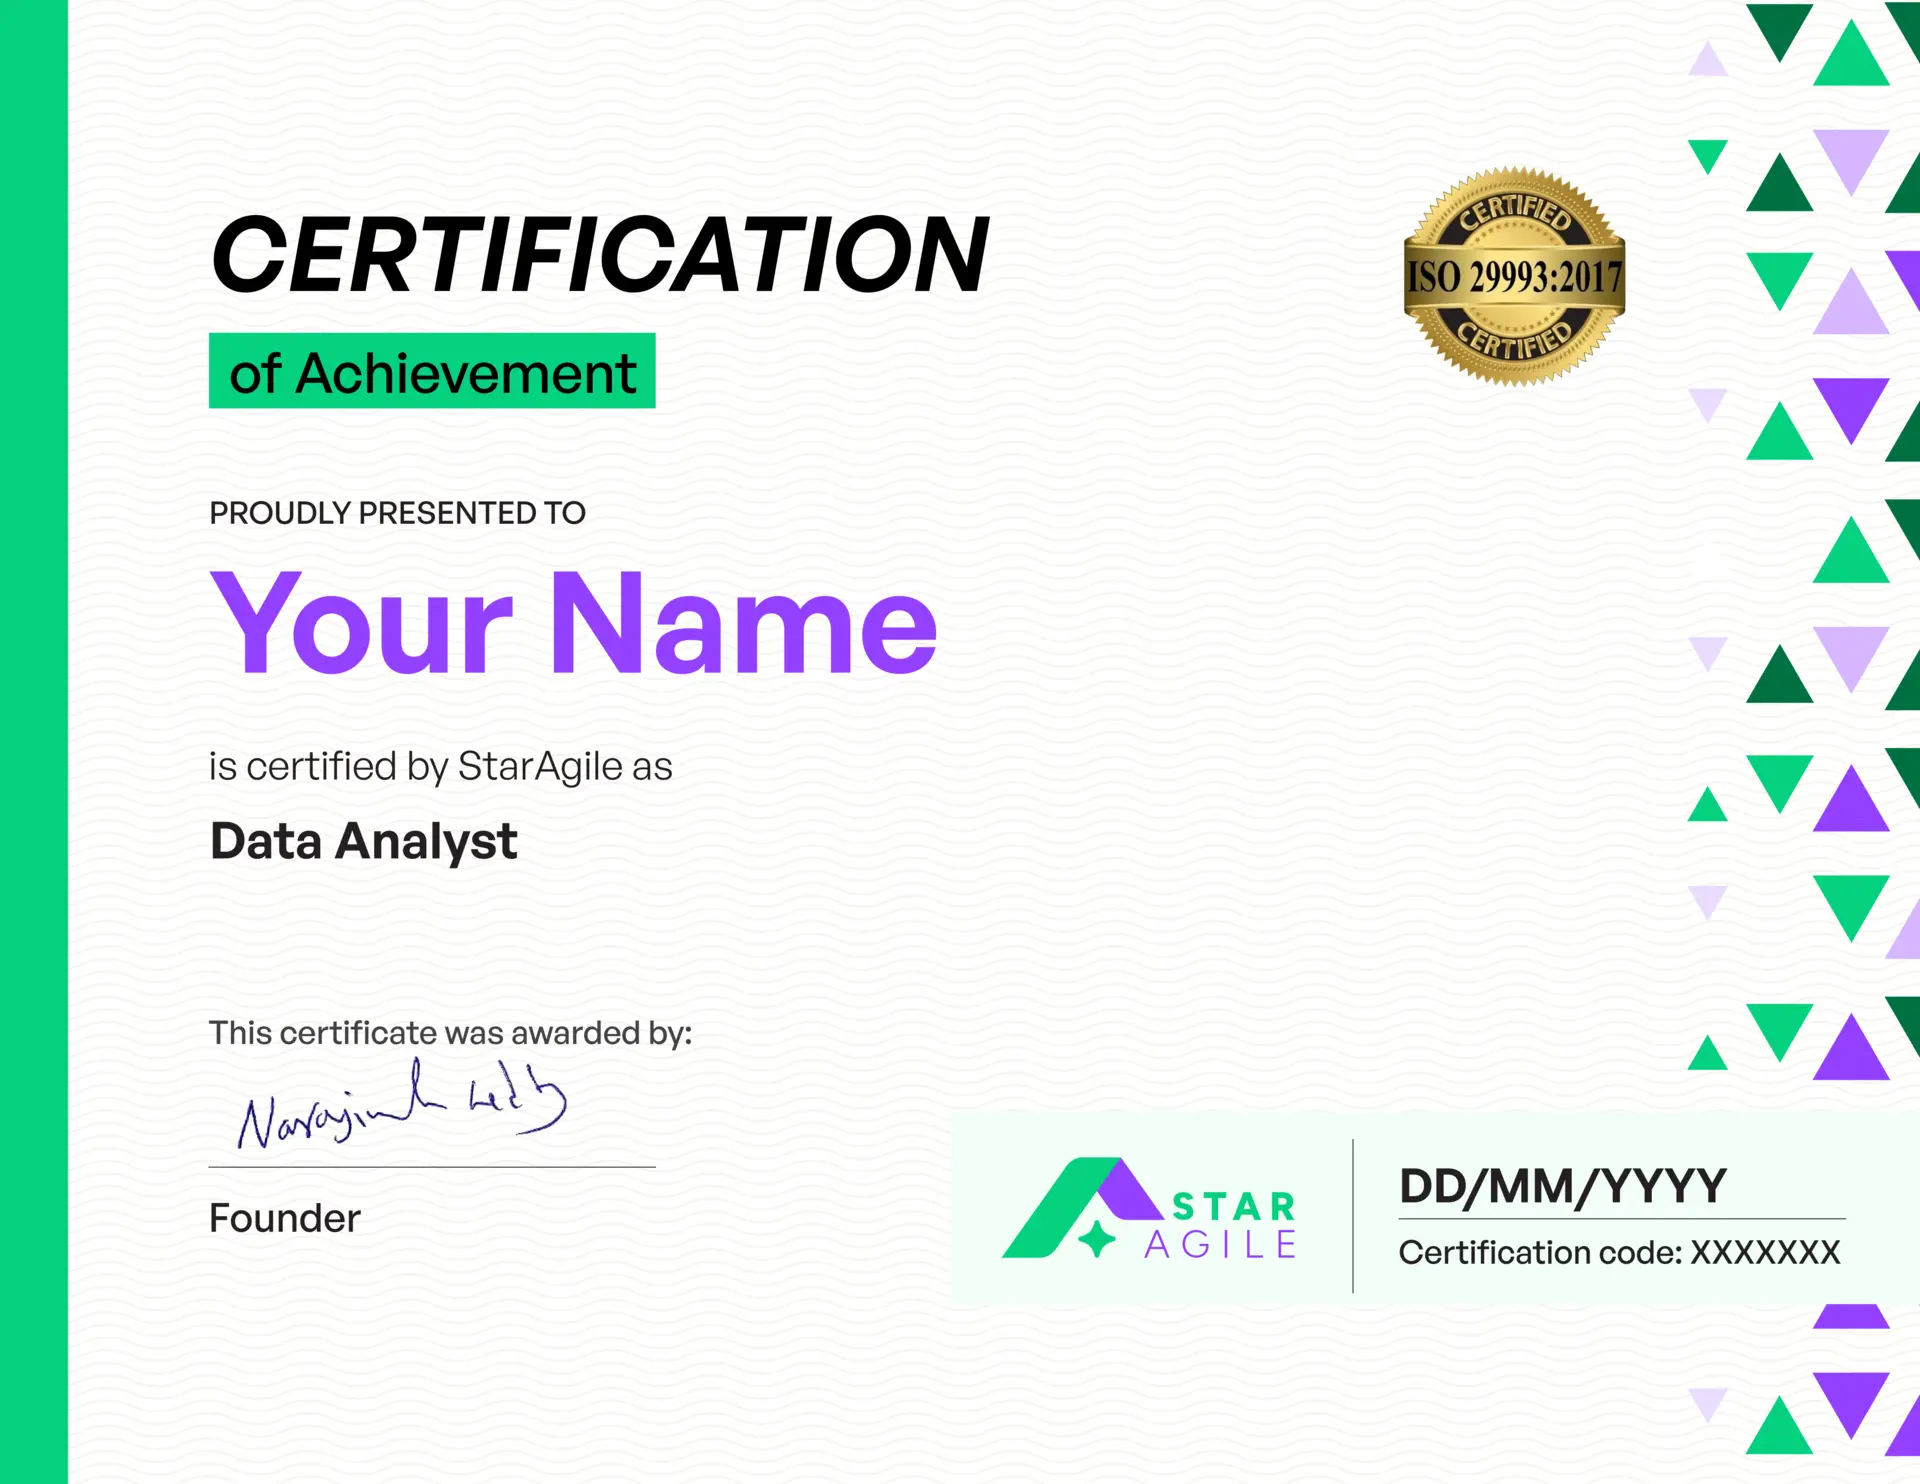
- Course Certificate
- Microsoft Certificate

Skills Covered
- Data Analytics Fundamentals
- Data Visualization with Tableau & Power BI
- Excel for Data Analytics & Dashboards
- Google Sheets for Data Management & Automation
- SQL for Data Analysis (Joins, Sub-queries, Window Functions)
- Python Programming Basics & Data Structures
- Data Analysis with Numpy & Pandas
- Data Cleaning & Transformation (Excel, Power Query, Python)
- Data Visualization using Matplotlib & Seaborn
- Regular Expressions for Data Processing
- Statistical Analysis & Reporting
- Capstone Projects in Real-World Domains
Tools Covered


Capstone Projects
Course Reviews

 Verified Learner
 The way of explaining the process and the traning program along with their mentors is excellent, it was fun learning and very good
TRAINING AND MENTORING SESSIONS WERE USEFUL CONCEPTS ARE CLEAR PROGRAM IS WELL STRUCTURED CAPSTONE PROJECTS WERE ALSO SO MUCH HELPFUL.
A good platform starts our learning journey. Mentor and trainer guidance and quick response from StarAgile team as well.. useful links and study materials are helping us to get more knowledge on tools and attending quizzes will get to know our mistakes and correct answers for any question.
I had a great experience during my training. The institute provides an excellent learning environment with well-structured sessions and up-to-date course materials. The trainers are highly knowledgeable, supportive, and always ready to clarify doubts. Their practical approach and real-world examples made the concepts easy to understand. Overall, it’s a great place to gain both theoretical and hands-on knowledge. Highly recommended!
i will be giving the genuine review as per my training went . The content staragile taught gave me the basic idea to start everytool but there is lot more to do to get a job ..... that's it rest all is well they taught well and they took classes well but we can do more.... and i didnt like the time the staragile took to complete the whole traing they took 4 months but in reality we can complete this in 3 months only this wasted my one month and we dont need 4 mentoring session only 2 is enough and we dont need only four training session we can handle 5 per week
The course training was very well-structured and interactive. The instructors explained the concepts clearly and made learning engaging. Adding a few more real-time use cases in future sessions would make the already excellent training even more impactful.
Data Analytics Classes Online - FAQs
To enrol in the data analytics certification, candidates only need a bachelor’s degree in any field, making the course open to both IT and non-IT professionals, as well as students looking to switch careers or upskill in a data analytics course. While some familiarity with statistics or Excel can be helpful, it’s not a requirement to get started.
The data analytics instructors are highly experienced professionals with backgrounds at leading MNCs and practical, real-world experience. They bring expertise in various areas of data analytics, including machine learning, data wrangling, and predictive analytics. Their practical knowledge helps you connect theoretical concepts with real-world applications, ensuring you gain a deep understanding of how data analytics functions in professional environments.
International Placement Assistance Details
StarAgile assists learners by sharing job opportunities that we receive through various sources, including company job portals, HR networks, and industry contacts. These opportunities are shared based on the requirements. Placement assistance support will be provided for a period of up to 6 months from the date of course completion.
- We only focus on job opportunities within the US, Canada, Europe and Remote opportunities.
- Remote opportunities shared may still require candidates to be legally authorized to work in specific regions, states, or provinces as defined by the employer.
- StarAgile does not provide visa sponsorship, work permits, immigration support, or employer sponsorship. Learners are responsible for ensuring they have valid work authorization for the country and role they are applying to.
- StarAgile does not offer or guarantee placements or interview opportunities.
- We at StarAgile, including all employees, do not provide job referrals, job opportunities, or direct recommendations.
- Compensation, salary ranges, and employment benefits are solely determined by the hiring employer and vary based on experience, skills, location, and market conditions. StarAgile does not influence or guarantee compensation outcomes.
- Learners are responsible for actively applying to job opportunities shared and participating in the job search process.
The data analytics certification is offered in a live online format. This adaptable format lets you study wherever you are without being cut off from live, interactive courses. You have the opportunity to interact with instructors and students in real time, pose questions, participate in discussions, and access materials on your own schedule. It's made to be fully integrated into the hectic lives of working professionals looking for data analytics training online through flexible data analytics classes online.
The data analytics certification course spans 104 hours. The schedule is built to suit both professionals and students, with options available on weekdays and weekends. This flexibility lets you pick times that work best for you while still covering key topics like data preprocessing, data cleaning, and predictive modeling, making it one of the best data analytics programs for career-focused learners.
Throughout the data analytics classes online, you'll be working on real case study projects and assignments that simulate real-world data analysis issues. These will be capstone projects in areas like Salesforce analytics and Tableau, building a strong portfolio. These will be capstone projects in areas like Sales Performance Analysis and Tableau, building a strong portfolio. These projects will give you the skills you need in data visualization, machine learning, and data-driven decision-making, preparing you for industry-specific work in data analytics online programs.
Yes, upon successful completion of the data analytics training certification, you will receive a certification from StarAgile, recognized globally by employers in industries ranging from marketing to finance. Additionally, you will also earn a 3-month internship certificate, which will add further value to your resume and enhance your job readiness, making it one of the best data analytics certifications available.
The certification demonstrates your proficiency in key data analytics tools such as SQL for Data Analysis, Python Data Analytics, and Excel for Data Analytics. It helps you get recognized by top employers in today’s competitive business environment. You'll be certified as a data analyst with this certification, becoming recognised in business intelligence, marketing, and other fields that value strong analytical skills.
We offer several convenient payment options for the data analytics certification course, including credit/debit card payments and instalment plans. This flexibility ensures that you can manage the course fees in a way that works best for you, allowing you to focus more on your learning experience.
To enroll in the data analytics training course, visit our website, fill out the enrollment form, and select your preferred payment option. Once completed, you will receive a confirmation email with all the details you need to get started, including login information for the data analytics training online programs.
If you miss a live session, you can easily catch up by accessing the recorded classes through the course portal. Additionally, our instructors are available for any follow-up questions or clarification. This ensures you stay on track with your learning, even if you miss a class in our best data analytics program or other data analytics online programs.
Absolutely! You can schedule a consultation with one of our course advisors to discuss any questions or concerns you may have about the course. This personalized session will give you a clearer understanding of how our data analytics online programs align with your career goals and help you make an informed decision before enrollment.
For more information, you can reach out to our support team via email or phone. You can also contact your dedicated course advisor directly through the website or using the contact information provided after scheduling your consultation for our data analytics online programs.
After completing the training, you’ll continue to receive career support, including interview preparation, resume building, and LinkedIn optimization. Additionally, you'll gain access to job opportunities through our network, which includes exclusive job openings in data analytics, product analytics, and marketing analytics roles, all of which are connected to our data analytics online programs.
While no specific prerequisites are required, we recommend reviewing basic Excel skills and gaining a foundational understanding of statistics. Familiarity with these topics will help you grasp the course material more quickly, particularly when learning about data wrangling and data preprocessing in the data analytics online course.
Yes, we offer a free demo session for prospective students of our data analytics certification. This allows you to experience the course format, interact with instructors, and get a feel for the curriculum. You can ask questions during the session to better understand the course structure before making a commitment.
This certification is ideal for both IT and non-IT professionals, as well as students who want to transition into data analytics or pursue careers in business intelligence, product analytics, or data-driven decision-making roles. No prior experience is necessary, although basic familiarity with Excel or statistics can be beneficial.
The data analytics certification course online covers essential modules such as data processing, data visualization, statistical analysis, machine learning, and hands-on training in Excel, SQL, Python, Power BI, and Tableau. These modules ensure a comprehensive understanding of data analytics tools and techniques, which are crucial for succeeding in real-world analytics projects.
The Basic Plan for data analytics training online includes live interactive training, doubt clarification sessions, a StarAgile certificate, LMS access, session recordings, and coverage of 6+ tools. The Pro Plan offers all the features of the Basic Plan, plus resume building, LinkedIn optimization, three mock interviews, 1-on-1 career coaching, a 3-month internship certificate, unlimited revision sessions, and a 10% discount on your next high-level agile certification.
Yes, you can withdraw from the data analytics certification. Refunds are available if the course starts after 3 days of enrollment and the request is made within 3 days. If the course starts within 3 days, refunds are only provided if requested before the course begins.
Data Analytics Certification Course - Advanced FAQs
Data analytics involves the process of inspecting, cleaning, transforming, and modelling data to extract useful information, support decision-making, and uncover trends. It is essential in various industries such as finance, healthcare, and marketing. If you're looking to acquire the skills necessary for these tasks, enrolling in the data analytics certification courses can provide you with the expertise and practical knowledge needed to excel in this field and enhance your career prospects.
Yes, the StarAgile data analytics certification is recognized by top employers globally. It enhances your capabilities and makes you a competitive data analyst job candidate with new career prospects. By enrolling in one of the best data analytics certification courses, you gain the practical skills and knowledge that employers are actively seeking.
With the skills and hands-on experience gained in this course, along with interview assistance and internship certification, your chances of getting hired as a data analyst increase significantly. By enrolling in the best data analytics program, you’ll be well-prepared to stand out to top employers.
The most in-demand roles include Data Analyst, Business Intelligence Analyst, Data Scientist, Data Engineer, and Data Visualisation Specialist, as organisations across industries look to harness data for decision-making. Completing the best data analytics program will equip you with the skills needed to qualify for these high-demand positions.
A typical Data Analyst career path starts with entry-level positions, followed by roles such as Senior Data Analyst, Data Scientist, and eventually positions like Data Analytics Manager or Chief Data Officer. Completing the best data analytics program can help you fast-track your career, equipping you with the skills and knowledge needed for these advanced roles.
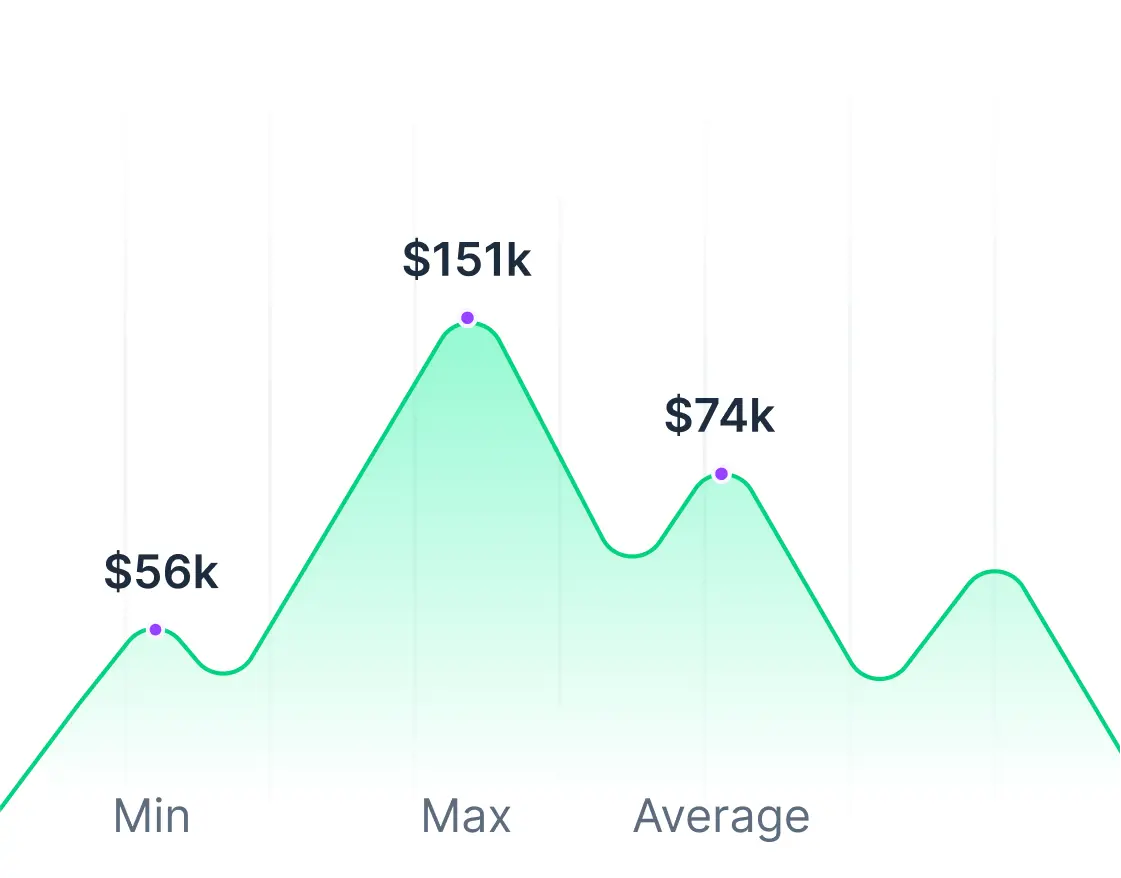
Yes, data analysts enjoy competitive salaries. The average salary ranges from $51k to $95k annually, and the $70k average salary according to PayScale, as you gain experience and specialise in advanced analytics roles. By completing a data analytics training course, you’ll be well-positioned to earn a higher salary and advance in your career.
Programming languages such as Python, and SQL are utilized by data analysts during data manipulation, analysis, and visualization. Basic coding skills are needed, but advanced programming expertise is not always required for every data analyst role. By enrolling in a data analytics training course, you’ll gain the foundational coding skills needed for data analysis and become proficient with key programming languages.
Data analysts typically use tools like Excel, SQL, Python, Power BI, Tableau, and other business intelligence software to clean, analyse, and visualise data. Enrolling in a data analytics training course will equip you with hands-on experience using these tools, helping you become proficient in data analysis and visualization.
Key skills of a data analyst include data manipulation skills, statistical analysis, data visualization, proficiency in tools like Excel, SQL, and Python, and improved problem-solving skills. By attending data analytics training classes, you’ll develop these essential skills and gain hands-on experience with industry-standard tools.
While the learning curve can be steep for beginners, the data analytics course at StarAgile is designed to help you grasp the concepts step by step. With hands-on practice and the support of experienced trainers, learning data analytics becomes much more manageable. By attending the data analytics training classes, you’ll gain practical knowledge and the confidence to apply it in real-world scenarios.
Yes, the course for Data Analytics is a fundamental course. It starts with basics and then slowly moves towards more advanced content, and hence, students who know nothing are able to keep up. By enrolling in the data analytics training classes, you'll receive a strong foundation and the support needed to progress through the course at your own pace.
Beginners can start by familiarising themselves with basic statistics and Excel. Data analytics training is specifically designed to introduce data analytics from the ground up, providing both theoretical knowledge and hands-on practice. By enrolling in the training, you’ll gain a solid foundation and practical skills to kick-start your career in data analytics.
Yes, in fact, a StarAgile data analytics certification is of immense worth in today’s job market. It proves your expertise and commitment to employers, and you are a valuable candidate for data analytics roles. By enrolling in the best data analytics training, you’ll gain the skills and knowledge to stand out to top employers.
A Data Analyst is responsible for gathering, processing, and analyzing data and uncovering trends and insights to guide business decisions. They use techniques and tools like statistical analysis and data visualization to communicate findings. By completing the best data analytics certification online, you'll gain the expertise needed to excel in these tasks and drive data-driven decision-making in organizations.
Yes, data analytics is a rapidly growing field with high demand. With the increase in data-driven decision-making, data analysts are crucial for businesses, and the career offers opportunities for growth and lucrative salaries. Enrolling in a data analytics certification can give you the skills and credentials to seize these opportunities and advance in the field.
It is not a requirement to have a degree to be a data analyst. But computer science, engineering, or mathematics would be beneficial to study. Our data analytics certification courses online offer a pathway to a data analytics career, regardless of your degree, providing you with the skills and knowledge needed to succeed in this growing field.
To become a Data Analyst, you'll need to build a strong foundation in key areas like data manipulation, statistical analysis, and data visualization to effectively analyze and interpret data. Completing a data analytics course certification, like the one offered by StarAgile, will equip you with the necessary knowledge and hands-on experience to excel in the field.
Yes, the course includes a 3-month internship program, providing you with hands-on experience in data analytics projects, which will help enhance your skills and make you more employable. Upon completion, you will earn a data analytics course certification, boosting your career prospects and making you stand out to potential employers.
Distinctions and Achievements

About Data Analytics Certification Course
What are the Eligibility and Prerequisites of Data Analytics
To enroll in the data analytics certification, all you need is a bachelor’s degree in any discipline.
These data analytics classes online benefit IT and non-IT professionals, as well as students seeking to move into data-driven careers.
No prior experience in data analytics is required; however, familiarity with Excel and basic statistics will be helpful.
Our data analytics classes online are ideal for those pursuing careers in analytics, business intelligence, or any role involving data based decision-making.
Completing the program enhances your employability in a rapidly growing industry.
What are the Data Analytics Course Benefits with StarAgile
At StarAgile, our data analytics training online combines foundational knowledge with real-world applications. You’ll learn to clean, transform, and model data to uncover insights, support decision-making, and address business challenges.
In today’s market, mastering skills such as statistical analysis, predictive modeling, visualization, and machine learning is critical. This data analytics training certification equips you with both theoretical understanding and practical capabilities.
Here’s how we ensure you gain maximum benefit from the data analytics classes online:
1. Industry-Leading Trainers: Our instructors have years of experience with top MNCs, giving you real-world insights. The data analytics certification online provides practical exposure to industry scenarios, helping you excel in analytics roles.
2. Comprehensive Curriculum: The data analytics course covers Excel, SQL, Python, AI Data Analytics, R, Power BI, and Tableau. From data collection to predictive modeling, you’ll be prepared to handle diverse analytics projects. This is why we’re known for delivering the best data analytics training in the market.
3. Hands-On Internship: The 3-month internship included in our data analytics classes allows you to work on live projects, building job-ready skills employers seek in candidates with the data analytics classes online.
4. Career Assistance: We provide mock interviews, resume optimization, LinkedIn profile enhancements, and one-on-one coaching—everything needed to succeed after completing your course.
5. Global Recognition: Our certification is respected by leading employers worldwide, ensuring your skills stand out in the competitive market.
What’s Included in the Data Analytics Course?
1. Live Online Classes – Interactive, instructor-led data analytics online sessions that combine theoretical concepts with practical demonstrations. Learn directly from experienced trainers while engaging in real-time discussions.
2. Practical Assignments & Case Studies – Data analytics online module includes exercises based on real-world scenarios. You’ll analyze datasets, create dashboards, and apply tools to solve practical business problems.
3. 3-Month Internship – Gain industry exposure through our data analytics program internship, where you work on live projects to build real-world experience and strengthen your portfolio.
4. Personalized Career Assistance – Our data analytics classes include resume building, LinkedIn profile optimization, and mock interviews to help you stand out in the job market.
5. Certification – Receive a data analytics certification from StarAgile upon completion, recognized globally and valued by top employers.
Comprehensive Training Solutions for Enterprises


People also viewed courses like